Crypto Staking Dashboard
The Problem: A Possible Token Dump
With the impending Token Generation Event, we had none of the promised utility. This presented the potential problem of thousands of users dumping our token on Day 1, which would tank the price of the token.
Success Metrics
These metrics were chosen based on conversations with the data team on what would be beneficial for the coins different economic pressures. Staking was a promised utility we knew we would need. we wanted to measure it because it would help decrease sell pressure. We wanted to measure the average holding duration from a experience perspective to see if users found continued value in staking.
20%
Staking Participation Rate
3 Weeks
Average Staking Duration
Teams We Oversaw
We oversaw several teams. Their mandate was "Make $NUTZ Usable". We created tasks for them, JIRA tickets, reviewed their work, gave feedback, and organized release dates. I oversaw the design work, and provided feedback on the dev implementation.
How Does Sell Pressure Occur?
I worked with the Data Team to understand how sell pressure occurs. We looked at:
1. Emissions: how minted tokens are releasing from the treasury.
2. Where those tokens will release to, and the time frame that they will create selling pressure in.
3. How many new tokens will release per month? Depending on utility this can increase sell pressure or increase buy pressure.
Overall Goal
By increasing buy pressure & decreasing sell pressure we can reduce the chances of a token dump. The goal is to stabilize the volatility of the token.
How Is The Competition Doing This?
I looked at many competitors but these were the top 3. I had many discussions with the team about what these companies did well and what they didn't.
What Do Our Users Tell Us?
I sent out surveys to better understand what our users valued. This gave us an idea of which utilities to lead with.
Life Changing Wins (Lottery) - 28.3%
Maximum $NUTZ Returns - 14.6%
Token Utilities Have Economic Outcomes
Injections increase liquidity in exchanges, enhancing buy pressure and potentially stabilizing or increasing price, depending on demand. Sinks reduce liquidity in exchanges, increasing volatility and sell pressure, which can decrease price if sell-offs exceed buying demand.
We Cannot Afford Everything
With limited Dev capacity we need to be mindful of which ideations we follow through with. We prioritized ideations by impact vs effort. We did this in a product trio - myself, my Senior PM, and my Senior Engineer.
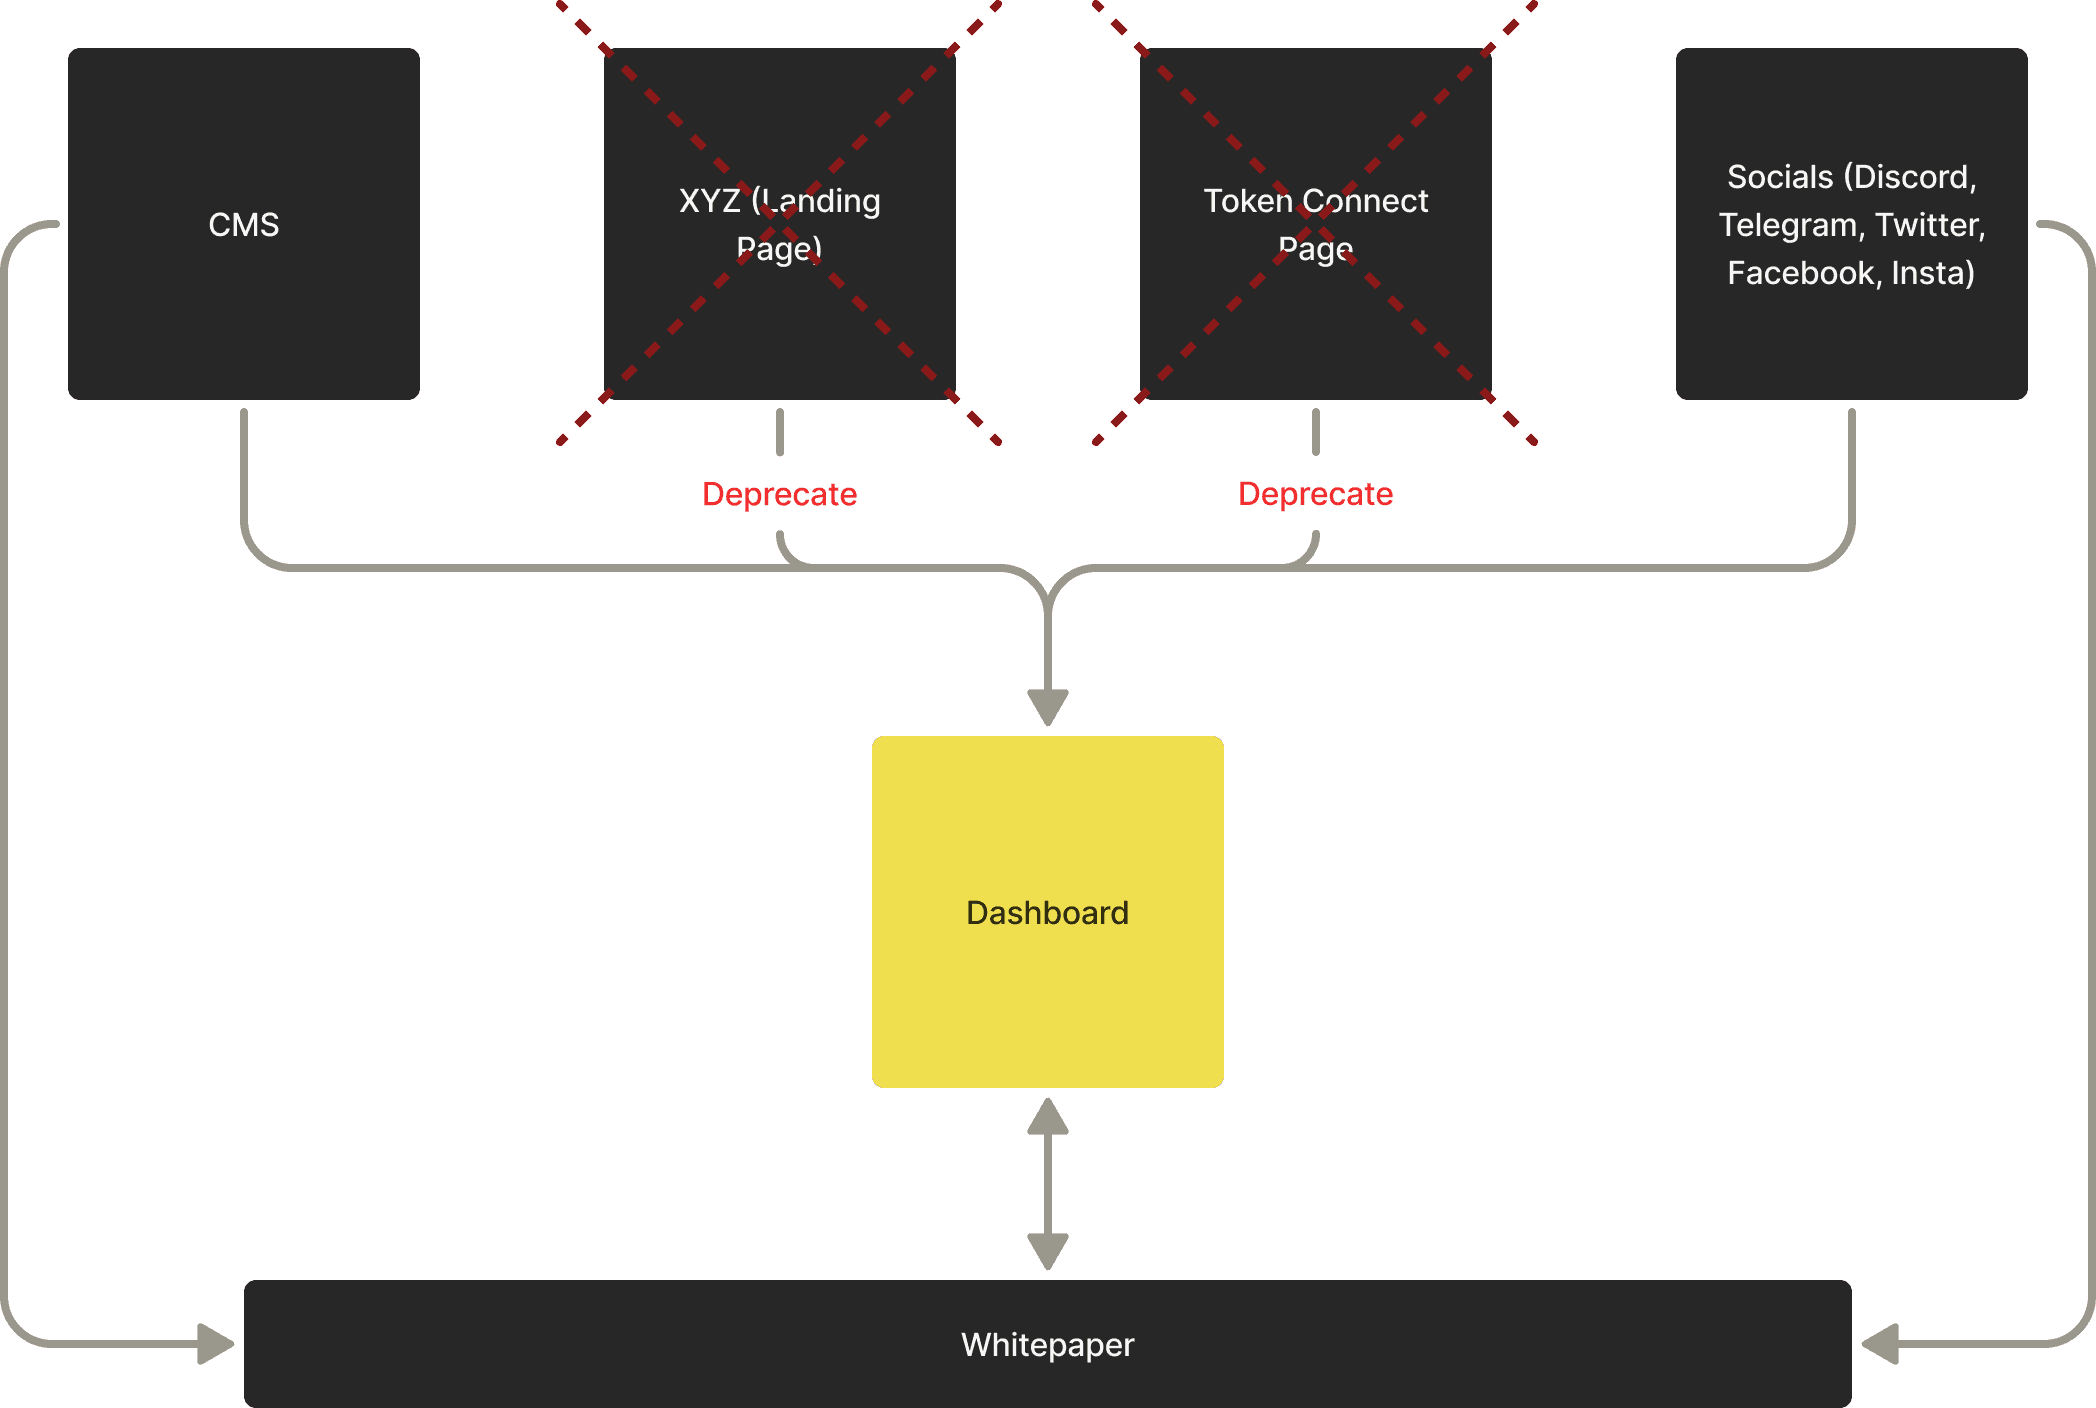
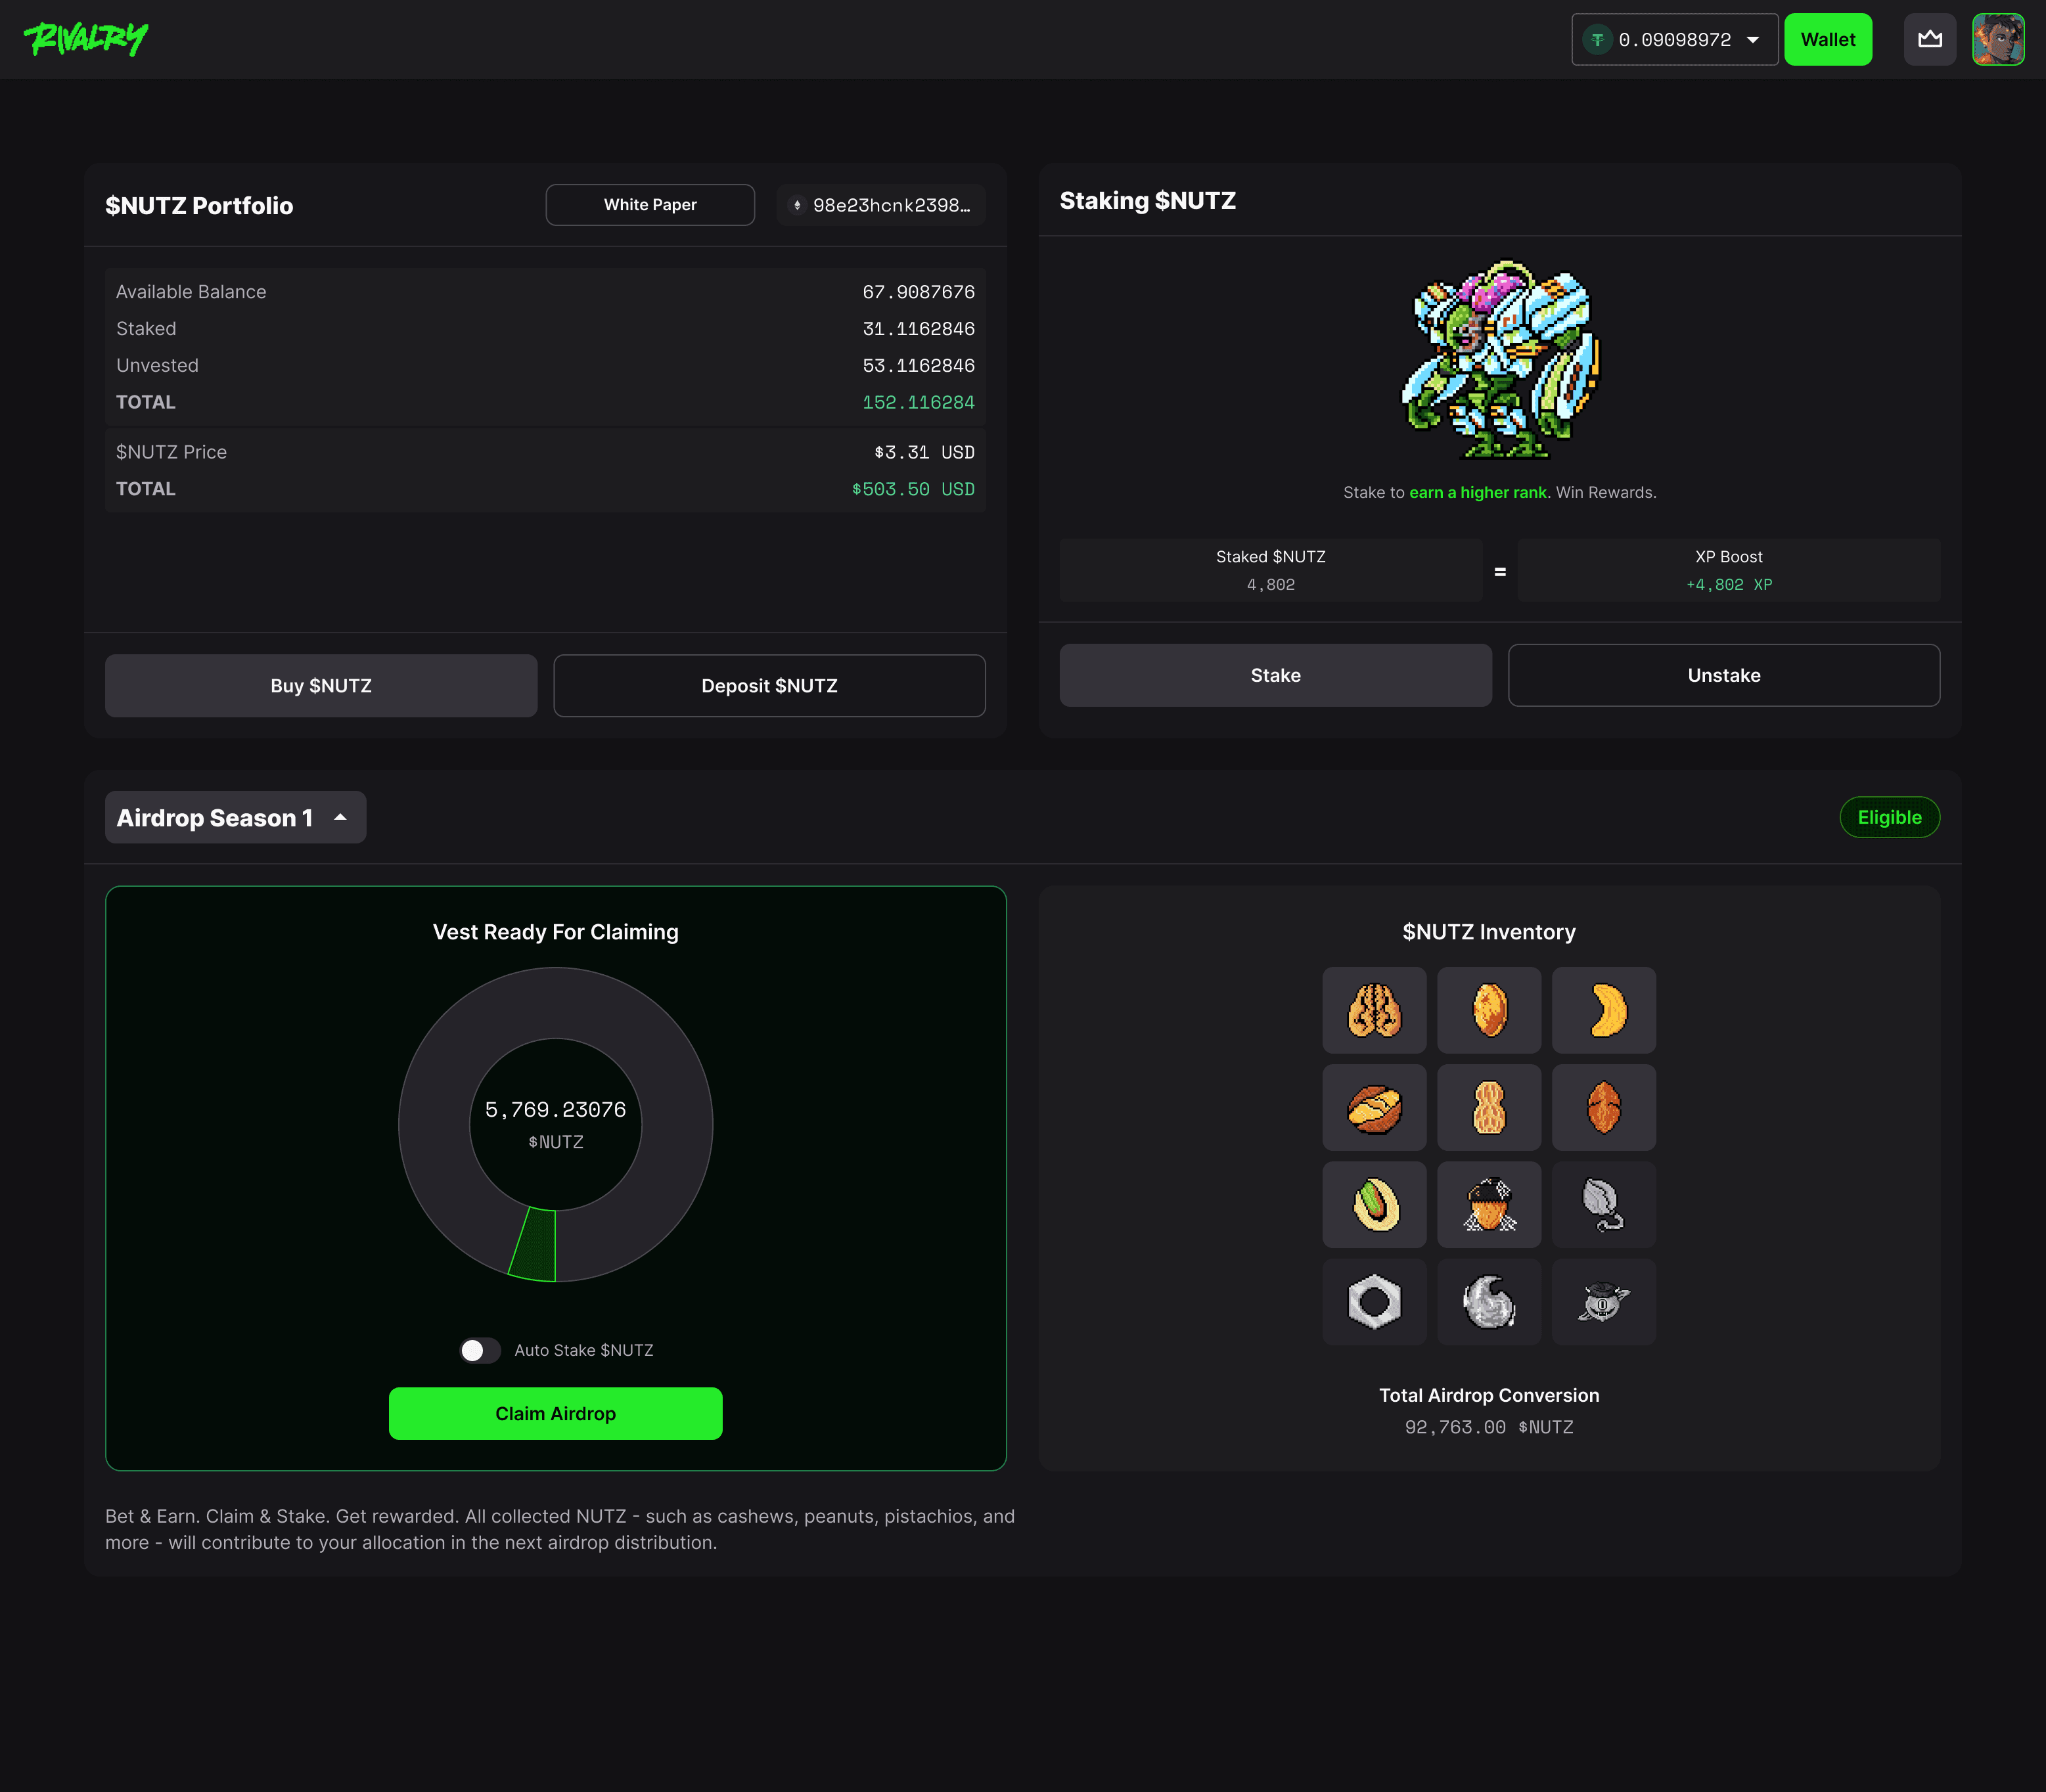
How Do Users Get To Our Experience?
I wanted to simplify how users consume and interact with our token experience. I also wanted to create a flow of information where everything led the user to a dashboard. I deprecated certain pages, which would then need to be absorbed into the dashboard.
Dashboard: Hierarchy Of Information
I wanted to get buy in on hierarchy. This would help us move through screen iterations faster.
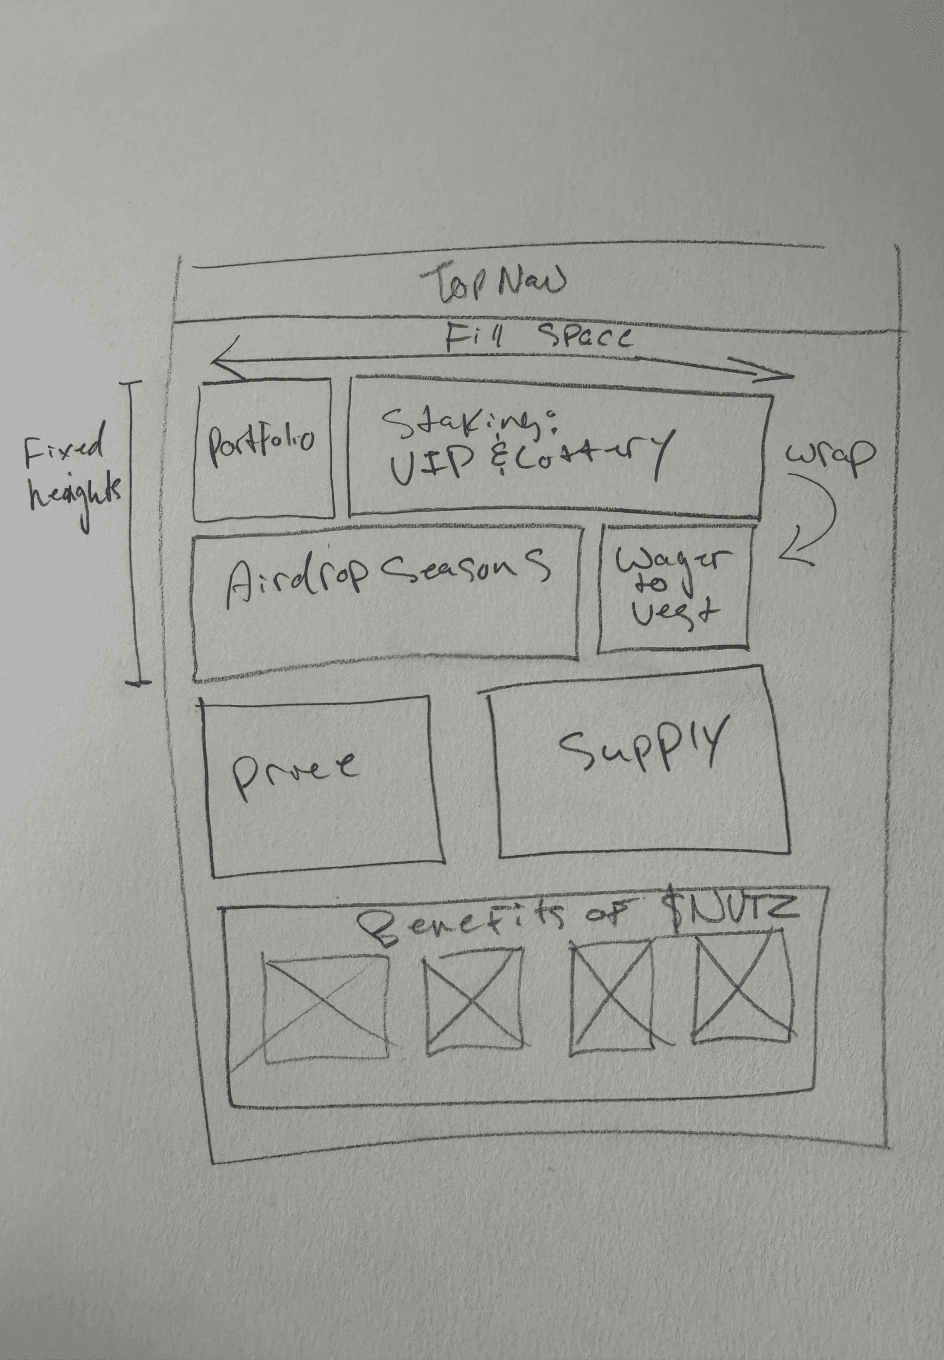
Progress & Iterations
I knew I wanted to explore some kind of bento box page. This would require fixed heights and wrapping containers that fill the space they are in.
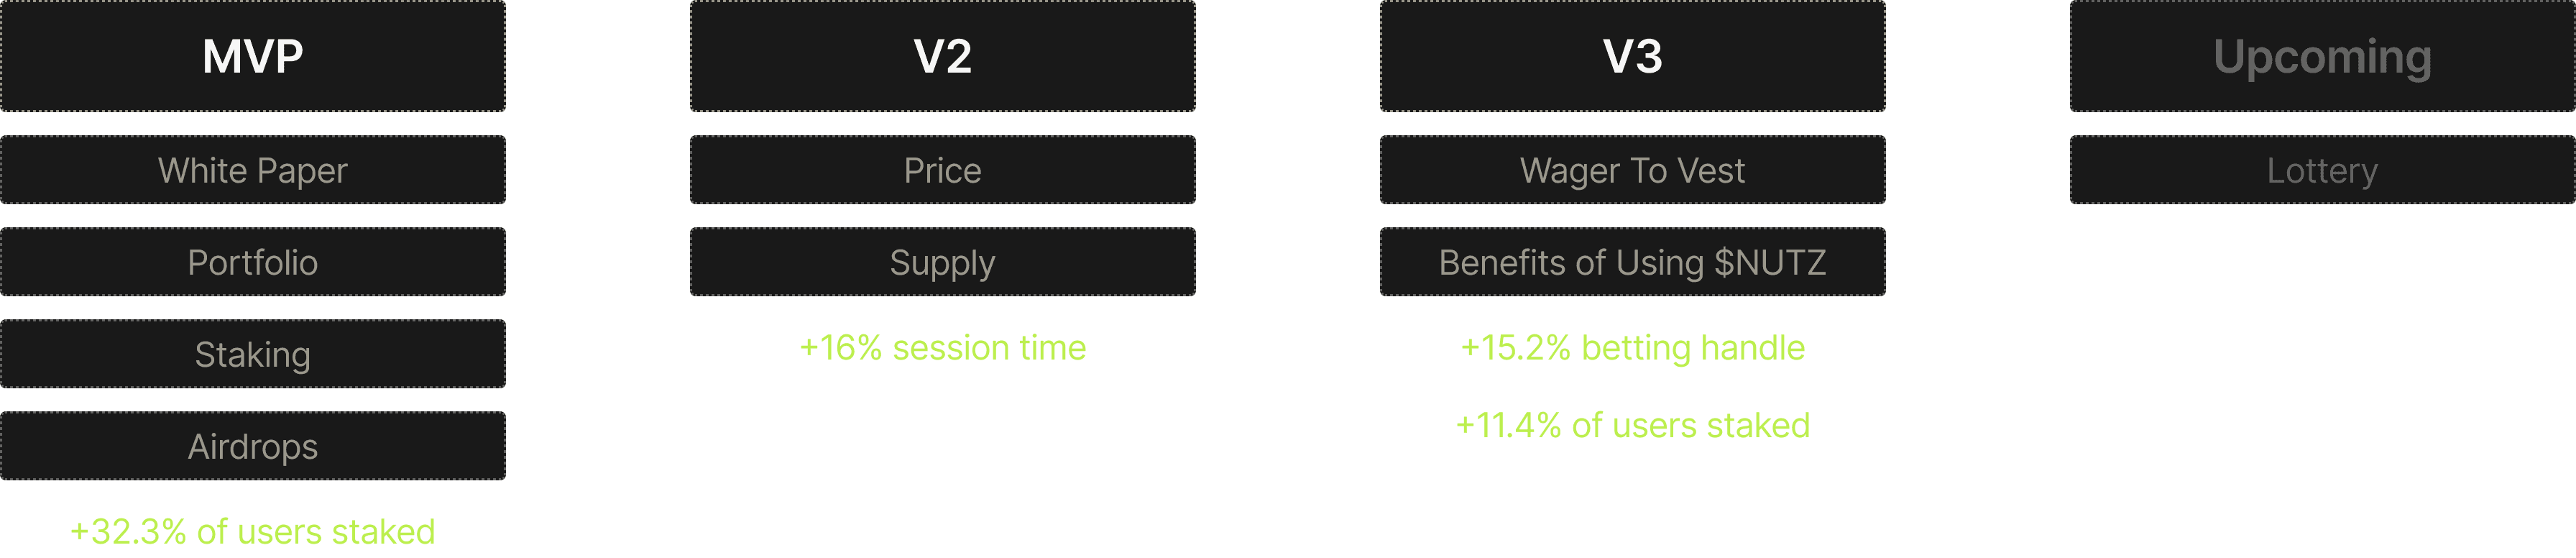
Launching & Measuring
We launched and measured outcomes in versions in order to get continuous buy-in with stakeholders.
Feedback: Fixing What Confuses People
Some things were confusing between these versions. I ran usability test sessions to help correct those experiences and to also push our team into new directions of what we should add and iterate on.
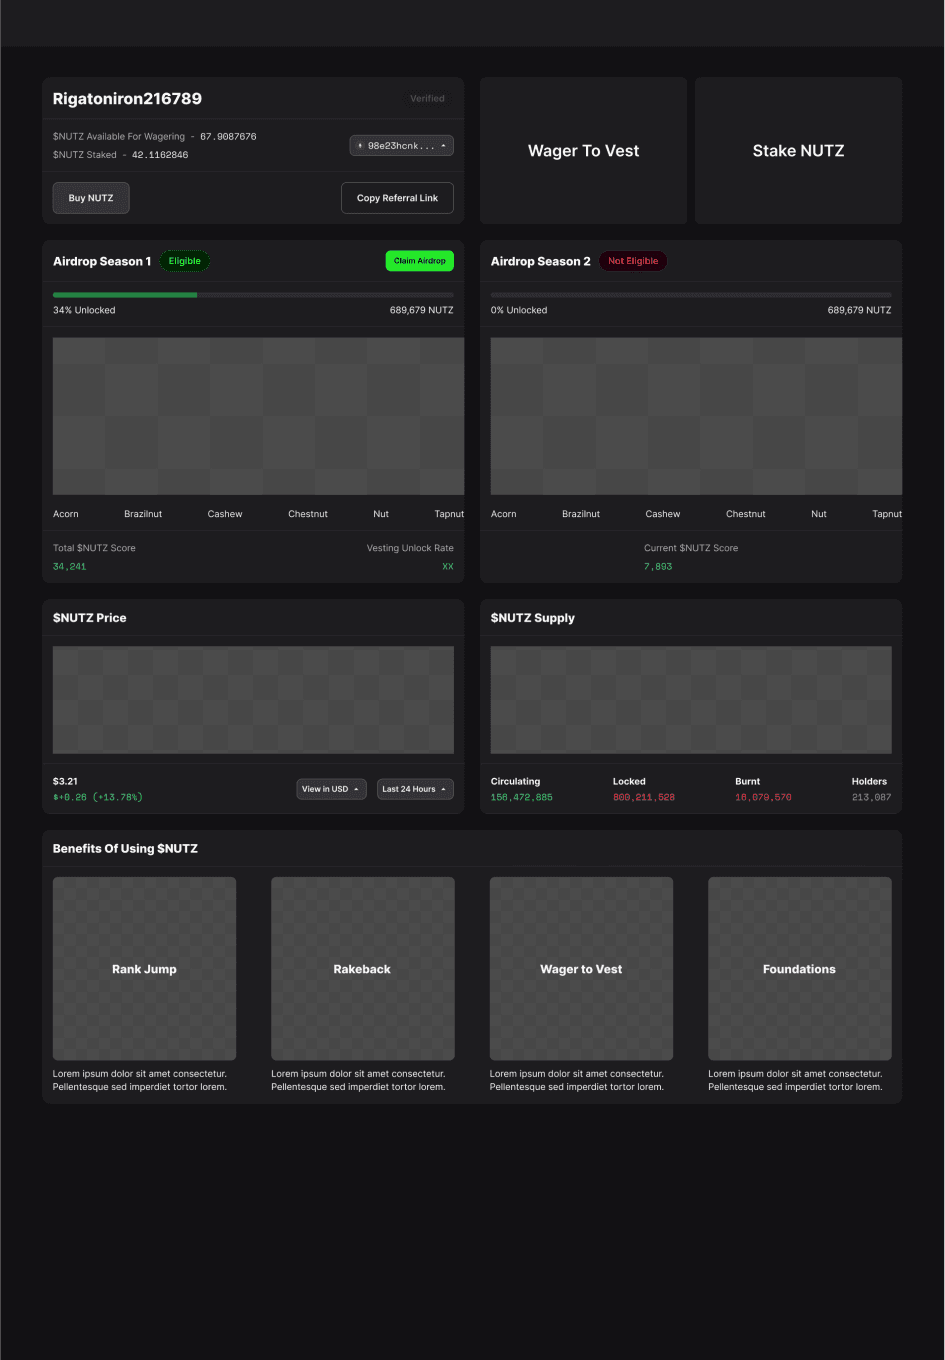
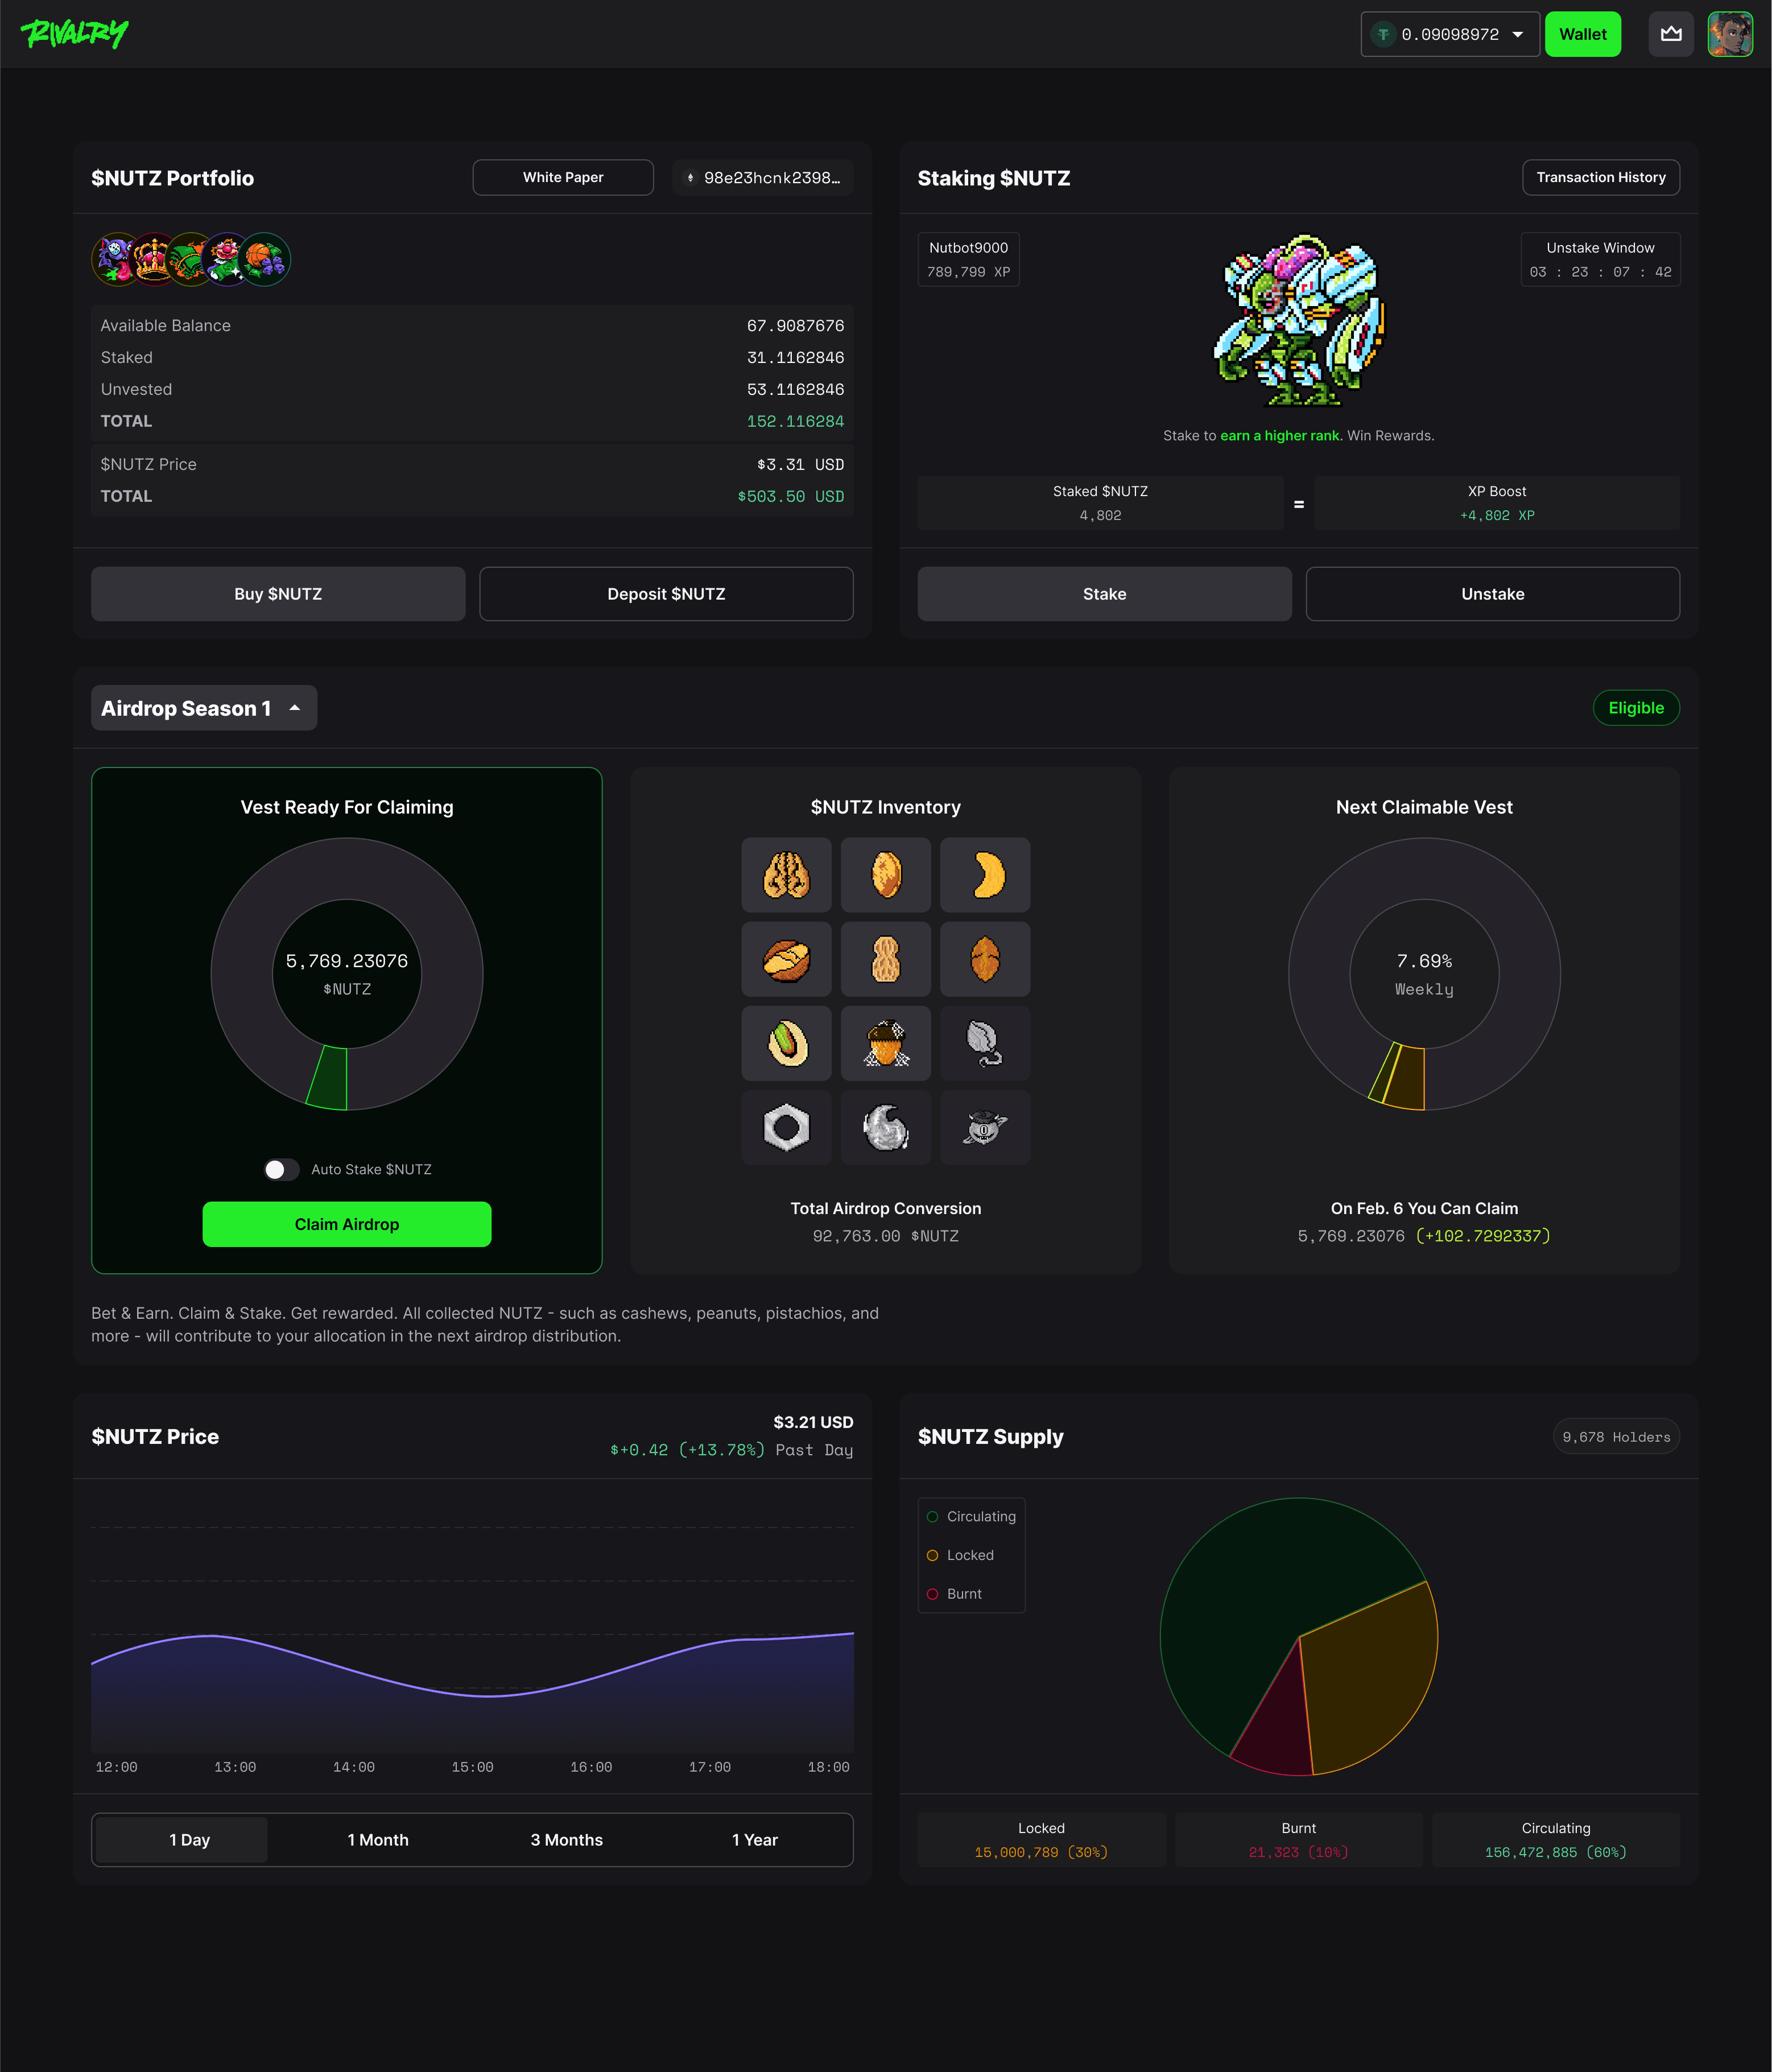
MVP, V1, V2
Below you can see the evolution of the dashboard between release versions.
Obstacle: Integrating Deprecated Work
I needed to fit the deprecated work into the dashboard, which was hard because I didn't want to bloat the page by adding more on screen information. Deprecated page can be seen below.
Solution: Interactive Components
I created interactive components that change as you interact with them. This saved space on the page and reduced cognitive load for our users.
Components
I created many components for this project. Here are some of them.
Responsive Design
We don't have a mobile app in all regions. In some regions we only have web. Meaning I needed to make sure we supported all screen sizes. To do this I made the page fully responsive.
Results
We far outreached our goals.
+43.7%
Staking Participation Rate
4 Weeks
Average Staking Duration
Learnings: Contributing To The Whitepaper
My PM and I worked directly with C-suite and external advisors to accomplish this. We came up with the mechanics, and worked with data team to validate the math.